
Introduction
Seavus Project Viewer is a complete viewer for Microsoft Project plans stored in .mpp files. It supports collaboration where people and teams need to view and share information from project managers, and it is a lightweight, fast standalone application that reads the native .mpp format without a previous installation of Microsoft Project.
It reads plans created in 2007, 2010, 2013 and 2016 and displays an extensive set of views over the project information. Version 3.0 closely matches the capabilities of Microsoft Project 2007, 2010, 2013 and 2016 when working with read-only plans, and needs no additional training for users with Microsoft Project experience.
What's new in 3.0
- Support for the Microsoft Project 2016 file format
- Support for Mac OS X 10.11 “El Capitan”
Who benefits
Users can open native .mpp files and read, view and print project plans without buying the more expensive Microsoft Project suite. They fall into three groups: team members involved in implementation, executives supervising the projects, and external users such as vendors, distributors, subcontractors and customers.
The number of people who need to view plans is significantly greater than the number who create them. Because a full Microsoft Project license is expensive for occasional viewers, many organizations hand out exported files or static pictures of plans — which leave out information that is only visible across several views. Someone may need the Gantt chart, then the task information for a selected task, then the resources assigned to it; that is exactly what static views lose.
With the viewer, the same information reaches everyone involved. Project managers communicate formatting, drawings, highlighting, grouping and data organization as defined in Microsoft Project, and the views are displayed with the same accuracy as the project manager created them.
Menus
File
Open a plan (the Open File dialog browses for a .mpp file), pick from Recent Files, close the current file, and print the open plan. Multiple files can be open at once through the Window menu.
Edit
Scroll to task moves to the area of the Gantt chart containing the bar for the selected task.
View
Switch between task and resource views, change the table associated with the active view, see and change the active filter, sort, hide or customize the toolbar, and enter full screen. The menu shows the current table (Table: [CurrentTable]) and current filter (Filtered for: [CurrentFilter]) and opens their sub-menus.
Tables
Lists the task or resource tables for the active view and changes the table in use. By default it contains the same tables as Microsoft Project when started for the first time.
Filters
Lists the filters and activates the chosen one for the active view.
Sort
Sorts the active view by a predefined field, in ascending order: tasks by start date, finish date, priority, cost or ID; resources by cost, name or ID.
Insert
Insert Column adds a field to the table of the active view; Hide Column hides the selected field.
Format
Timescale changes the timescale units for a closer look at the project details.
Project
Opens the information dialog for the selected task or resource, or the Project Information dialog.
Window
Minimise the active window to the Dock, zoom it, or bring all of the application's windows to the front.
Help
Search the project file, open the help contents, open the customer support page, the What's New page or the product website in a browser.
Toolbar
The standard toolbar carries the actions used most when viewing projects: Print, Gantt Chart, Task Sheet, Resource Sheet, Insert Columns, Hide Columns, Task/Resource Info, Project Info, Scroll to task, Filter, Sort, Table, Timescale and Zoom.
Views
Views display, in a particular format, a subset of the information entered in Microsoft Project. That subset is stored in the .mpp file and can be shown in any view that calls for it. A view is made of tables, filters, groups and details; changing the table or filter does not add or delete anything in the file, it presents the same information differently. The project manager's saved formatting is read back on opening, so a view appears as it does in Microsoft Project.
Gantt chart
The Gantt chart shows information two ways: a sheet on the left and a chart on the right. The sheet holds the tasks with when they start and end, how long they last, and the resources assigned. The chart draws each task as a bar; the bar's length and position on the timescale show when the task begins and ends, and the position of one bar relative to another shows whether tasks follow one another or overlap.
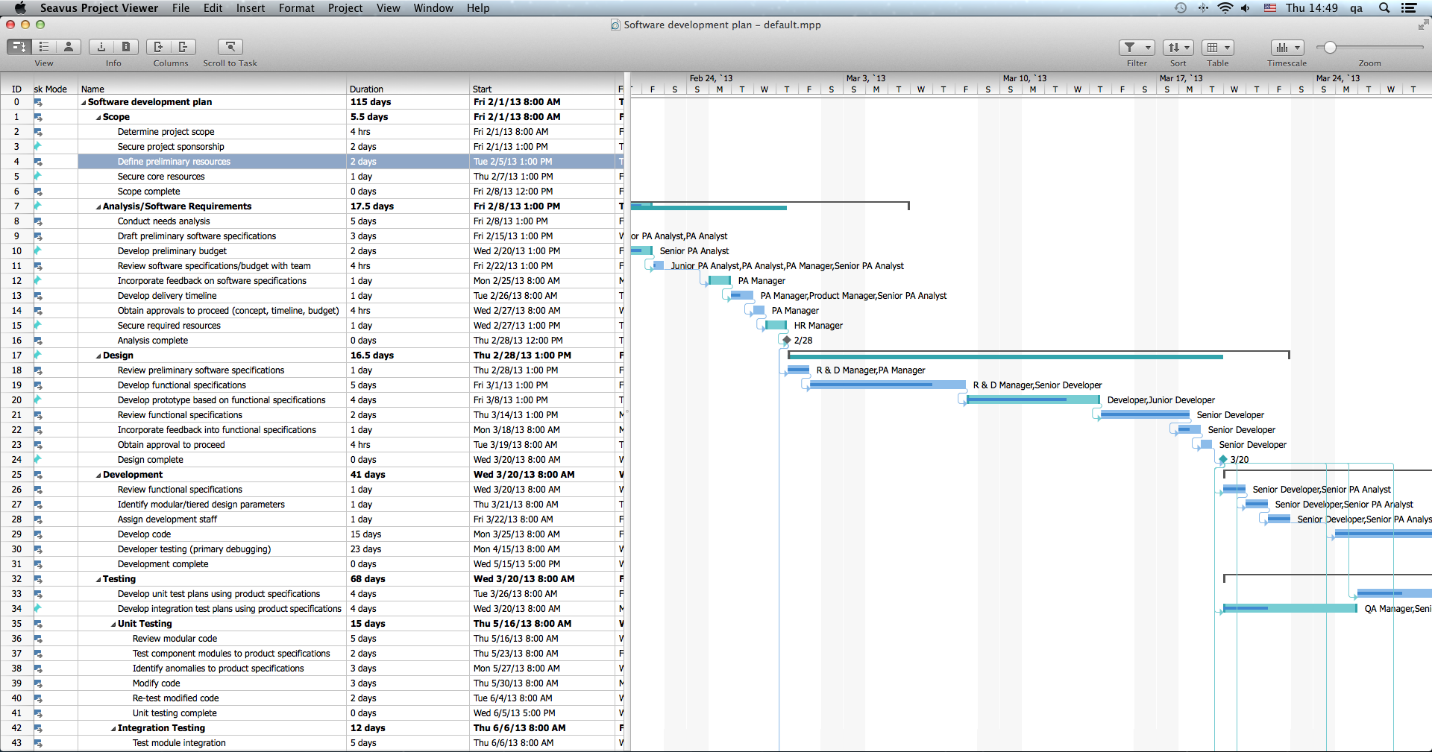
Additional Gantt chart views created by the project manager appear alongside the standard one. The viewer reads the layout options (link drawing, date format, bar height), bar styles, the formatting of individual bars, and the timescale formatting for each view. Layout options can be changed for the active view, and the timescale tiers shown, hidden or restyled.
The default table for the Gantt chart is the Entry table, and any task table can be selected. Any task filter can be applied, and the sheet and chart both follow it; the default filter is All Tasks.
Task sheet
The Task Sheet shows each task's duration, start and finish dates and cost in a sheet. The standard view and any custom-created Task Sheet views are supported. Use it to read the task list quickly when the timing does not need to be seen graphically, and to review progress by comparing baseline dates with actual start and finish dates and checking each task's progress.
The default table is the Entry table, any task table can be chosen, and any task filter applied; the default filter is All Tasks.
Resource sheet
The Resource Sheet shows each resource's payment rate, assigned work-hours, and planned and actual cost. A resource can be a person, a company or department, a piece of equipment, a room, or anything else used for the project. The standard view and any custom-created Resource Sheet views are supported.
Use it to review resource information, compare planned cost and work against actual, review the hours assigned to each resource and their costs, and evaluate how effective a person has been on the project. The default table is the Entry table, any resource table can be chosen, and any resource filter applied; the default filter is All Resources.
Team planner
The Team Planner belongs to the resource assignment category. It is split into two frames: the upper frame shows all assigned tasks in the plan, the lower frame the tasks that missed resources, such as milestones or ordinary tasks. Each frame has a sheet on the left and a chart on the right, and tasks with resource overallocation are drawn on a red background.
Use it to view tasks graphically with the assigned resource details, see the unassigned tasks, find which resource is overallocated and on which tasks, and view the unassigned and unscheduled areas of the plan. The view can show or hide unassigned and unscheduled tasks, and expand or collapse resource rows. It does not use a table, and it can apply any resource filter; the default is All Resources.
Tables
Predefined Microsoft Project tables show only the fields wanted, and custom tables can be created. There are task tables and resource tables. The table for the active view is changed from the Tables sub-menu of the View menu, or by right-clicking the top-left cell of the sheet.
Task tables
- Cost — cost information, including cost, planned cost, variance, actual cost and remaining cost
- Entry — task name, duration, start and finish dates, predecessors and resource names
- Summary — task duration, scheduled start and finish, percent work complete, cost and work
- Usage — the tasks with their work, duration, and start and finish dates
- Work — baseline work, work variance, actual work, overtime work and remaining work
Resource tables
- Cost — cost, planned cost, variance, actual cost and remaining cost
- Entry — resource type, group, standard rate, overtime rate, cost per use and accrual method
- Summary — resource name, group, standard and overtime rates, maximum units and peak units
- Usage — the resources and how much work is assigned to each
- Work — baseline work, work variance, actual work, overtime work and remaining work
Custom task or resource tables created by the project manager are read from the .mpp file and offered in the Tables menu, or the More Tables dialog.
Filters
A filter displays only the information you are interested in and hides the rest; it does not delete anything from the project. All standard task and resource filters are supported, and the filter for the active view is changed from the Filters sub-menu of the View menu or the Filters drop-down on the toolbar.
Task filters
- All Tasks — every task, regardless of its characteristics
- Completed Tasks — tasks marked as 100% complete
- Critical — tasks on the critical path
- In Progress Tasks — tasks that have started and are not completed
- Incomplete Tasks — all tasks and assignments that have not finished, whether or not they have started
- Milestones — milestone tasks only
- Summary Tasks — summary tasks only
- Unstarted Tasks — tasks that have not yet started
Resource filters
- All Resources — every resource
- Resources – Material — material resources such as wood, nails or cement
- Resources – Work — work resources such as people and equipment
- Work Complete — completed assignments, and resources that have completed all their assigned tasks
- Work Incomplete — resources with scheduled work less than their baseline work
Graphical reports
The visual reports and dashboards read the health of the plan: team members see upcoming tasks, tasks behind schedule and critical tasks; team leads and stakeholders see task and resource costs against the budget, and the project status through the burndown reports.
The categories are Dashboard (Cost Overview, Work Overview, Project Overview, Upcoming Tasks), Resource (Resource Overview) and Cost (Cost Overruns, Resource Cost Overview, Task Cost Overview).
Graphical reports cannot be generated from project plans on Microsoft Project Server, password-protected files, or plans imported from Microsoft Excel, Microsoft Outlook or the .xml format.
Project overview
The Project Overview report shows the % Complete of the project, the upcoming milestones and the late tasks. It contains one column chart, % Complete, showing the status of all top-level tasks, and two tables: milestones due compared with the current date, and late tasks whose due date has passed.
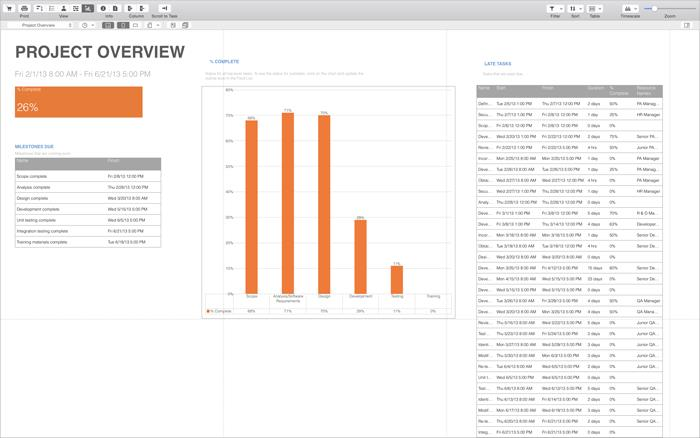
The report can be customized: move the label and change the report name, set the label's font, size and colour, format the label's line and fill, move and resize the chart and the table, and set the font, size, colour and fill of the table cells.
Upcoming tasks
The Upcoming Tasks report shows the work done in the week, the status of the remaining tasks and the tasks that start soon. It has one column chart, Remaining Chart, showing the remaining tasks due in the reported week, and one table, Task Starting Soon, with the work, start and finish date and resource name for each task that starts in the upcoming week. It carries the same customization options as the Project Overview report.
Work overview
The Work Overview report gives work statistics for all top-level tasks, so the percentage complete and what is left to be done are visible. It has two charts: Work Stats for all top-level tasks, and Resource Stats for all work resources.
Resource overview
The Resource Overview report shows the working status of the project's resources, the work done and the remaining work. It has two column charts: Resource Stats, showing actual, remaining and baseline work for all resources, and Work Status, showing the percentage of work done by each resource. A Resource Status table shows the remaining work for every resource.
Cost overruns
The Cost Overruns report shows the cost variance for all top-level tasks and working resources, to indicate whether actual cost overruns the budget. It consists of the Task Cost Variance chart, a line chart for the top-level tasks, and the Resource Cost Variance chart for the work resources.
Resource cost overview
The Resource Cost Overview report presents the cost status for all working resources, human and material. It has a Cost Status chart, a Cost Distribution pie chart showing how costs are spent among resources, and a Cost Details table for all resources.
Task cost overview
The Task Cost Overview report presents the cost status for all top-level tasks. It has a Cost Status chart, a Cost Distribution pie chart showing how costs are spent among tasks by status (complete, on schedule and future) and a Cost Details table for all top-level tasks.
Generating a report
- Open the project plan.
- From the View menu, select Report.
- A report sub-toolbar appears with the main features for working with reports.
- From the Report drop-down list, select the report. The viewer generates it, and the label, table and chart can then be customized or the report printed.
Editing a report
Report elements are edited with the Task Panel, a working area that expands with features for the selected element. Select the element, choose Format in the Report sub-menu, and pick the options for it: Shape Style for the frame's colour, Text Format for the text, Arrange for the position, and, for a table, Table Data for its contents. Changes are saved automatically; Reset Report in the Report sub-menu clears the customizations and restores the initial view.
Charts
Report charts can be drawn as 22 chart types: clustered, stacked and 100% stacked columns; line, stacked line, 100% stacked line and their line-with-markers variants; pie, pie of pie, bar of pie and doughnut; clustered, stacked and 100% stacked bars; area, stacked area and 100% stacked area; and radar, radar with markers and filled radar. To change the type, select the chart, choose Format, and pick from the Chart Type library.
Chart elements — axis, axis title, chart title, data labels, data table, gridlines and legend — are switched from the Chart Layout section of the Format bar after selecting the chart.
Filtering and fields
To filter a chart's data, select the chart and choose a criterion from the Filter drop-down in the Chart Data section; the list holds task or resource filters depending on the report type. Fields can be added to or removed from the chart, and several fields from the same category — cost, actual cost and remaining cost, for example — can be compared. The Active Field drop-down in the Chart Data section holds the fields added to a chart; the manual's walkthrough changes the active field of a pie chart and the chart updates.
Additional features
Timescale formatting
Views such as the Gantt chart have a timescale at the top, displaying two tiers by default: a top and a bottom tier. All tiers can be adjusted independently to the level of detail needed. For some views the non-working time can also be set: the calendar that defines working and non-working days and times, the colour and pattern used to draw non-working time, and how it is drawn in relation to the task bars.
Date format
Specifies the format for displaying dates. Format Date is in the Format menu. Some information, such as time formats and the date separator, is set through Mac Control Panel. This is a global setting for the application.
Printing
Printing a view or report follows the same steps: select the view that best presents the information, make display changes such as scaling to fit a page, preview before printing, then print. The Print dialog is on the File menu, and some options differ between views.
- Set the number of copies in the Copies field.
- Choose All to print every page, or From and type the first and last page.
- Choose the paper size in the Paper Size drop-down.
- Choose Portrait or Landscape for the orientation.
- Choose Date Range and set the start and end for a specific time frame.
- Type a percentage in the % Scale box to scale the pages.
- Under Scaling, choose Fit to and set the number of pages wide and tall (some views only).
- Select Print header and footer to print the plan's header and footer.
- Select Print ID column on all pages to show each row's ID on every page.
Information dialogs
The dialogs match their counterparts in Microsoft Project:
- Project Information — basic scheduling information: start and finish date, whether tasks are scheduled from the start or the end, and the base calendar. Project Statistics opens from here.
- Project Statistics — overall statistics for start and finish dates, duration, work and costs.
- Task Information — name, duration, percent completed, priority, start and end dates, constraints, deadline, task calendar, predecessors, assigned resources and notes.
- Resource Information — name, email, type, booking type, availability, calendar, cost rates and notes.
The application also has an interactive dialog that lets a user enter information and send it to the project manager.