








Align your organization for maximum utilization of MPP project data

You only need one tool to view project data with 100% accuracy. Seavus Project Viewer can easily scale up and adapt to your ever-growing team and expansion of projects created in MS Project.

Request an Enterprise Quote
  • Opens MPP files from the latest MS Project version
  • Reduces costs for hardware and software
  • Operating system flexibility - Suitable for companies that use macOS and Windows (combined or solely)
  • Effortless distribution of data (email, chat, shared folder)
  • Multilanguage availability
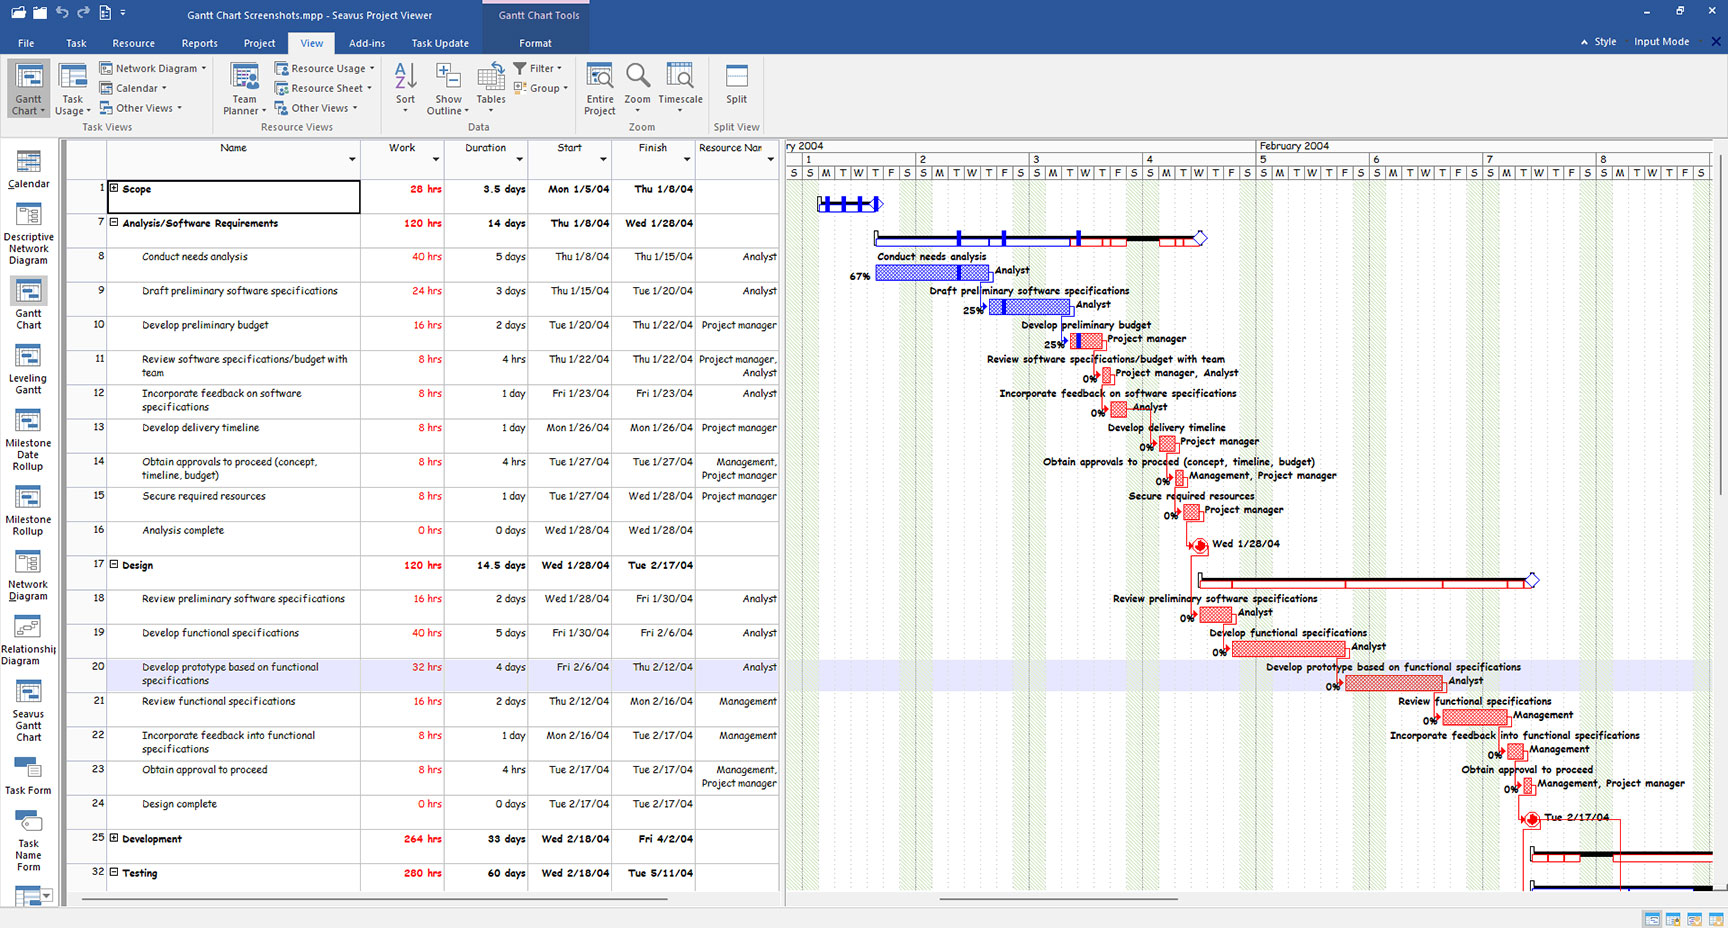
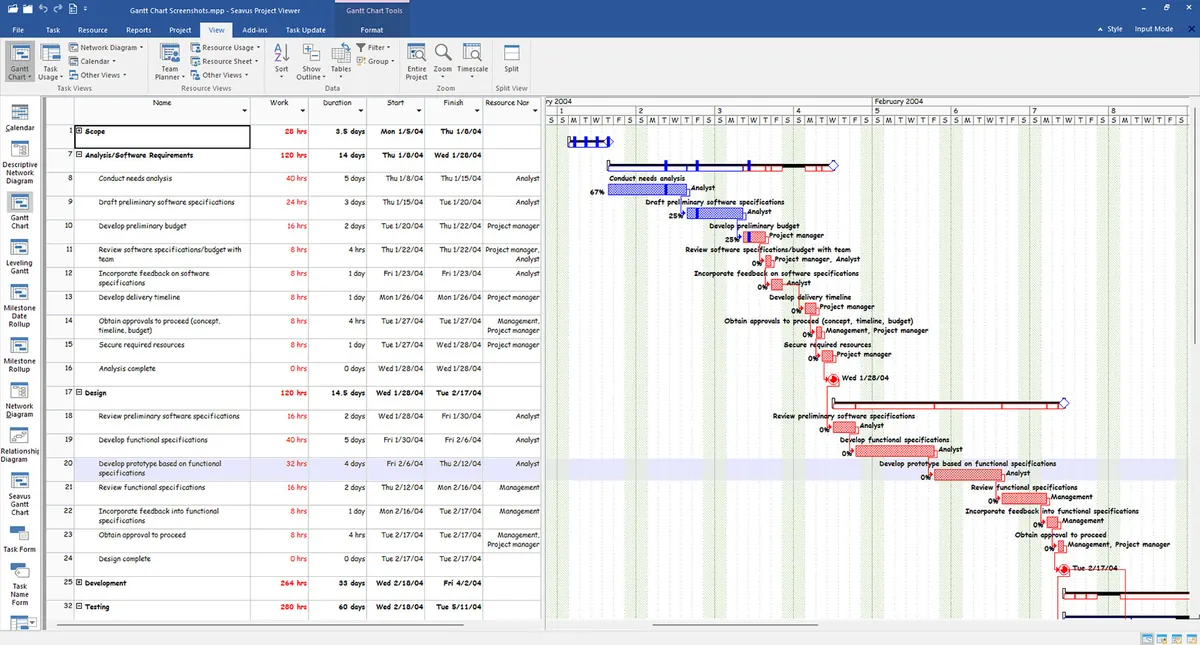
Seavus Project Viewer showing a Gantt chart of a Microsoft Project plan

Seavus Project Viewer, an essential MPP viewing tool

Accessing and analyzing project plans matters most on large-scale projects. Seavus Project Viewer does it swiftly and efficiently, which makes it an essential tool for the viewing group: team members, executives and external project stakeholders.

What the authors of the plans create in Microsoft Project is instantly accessible to that group, in a cost-effective tool that can be easily adopted internally.

Trusted and used by millions of users in the largest companies around the world

  • Baker Hughes
  • BMW
  • Rolls-Royce
  • Ford
  • Volvo
  • Michelin
  • General Dynamics
  • Honeywell
  • NATO
  • SAP
  • Tesla
  • Orange

Industries Aerospace · Automotive · Finance · Engineering · Education · Energy · Government · Healthcare · Manufacturing · Services · Technology · Telecommunications

The views your roles need

Bigger scale means a bigger need for different views, and Seavus Project Viewer has 26 of them. A view is a saved slice of the .mpp file, built for one reading: stakeholders who want milestones, HR managers who need staff capacity and working hours across projects.

A Gantt Chart View in Seavus Project Viewer

Gantt chart view

  • Split sheet with start, finish, duration and resources for every task
  • Table and task bars side by side
  • Bars show sequencing and potential overlaps

Default Microsoft Project Gantt charts: Bar Rollup, Milestone Rollup, Milestone Date Rollup, Detail Gantt, Leveling Gantt, Tracking Gantt, Multiple Baseline Gantt.
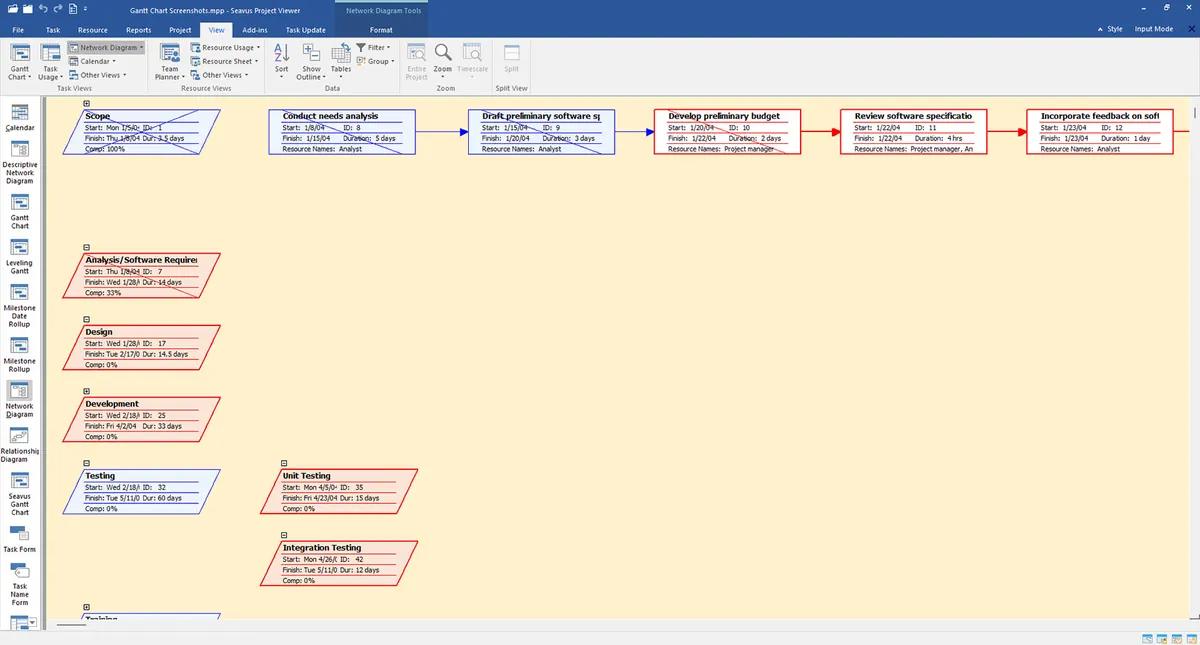
A view of Seavus Project Viewer's Network Diagram

Network diagram

  • Tasks as boxes, with lines between them marking dependencies
  • A diagonal line marks a task in progress, a crossed line marks it complete

Two standard views, as in Microsoft Project: Network Diagram and Descriptive Network Diagram, the second with room for labels inside each box.

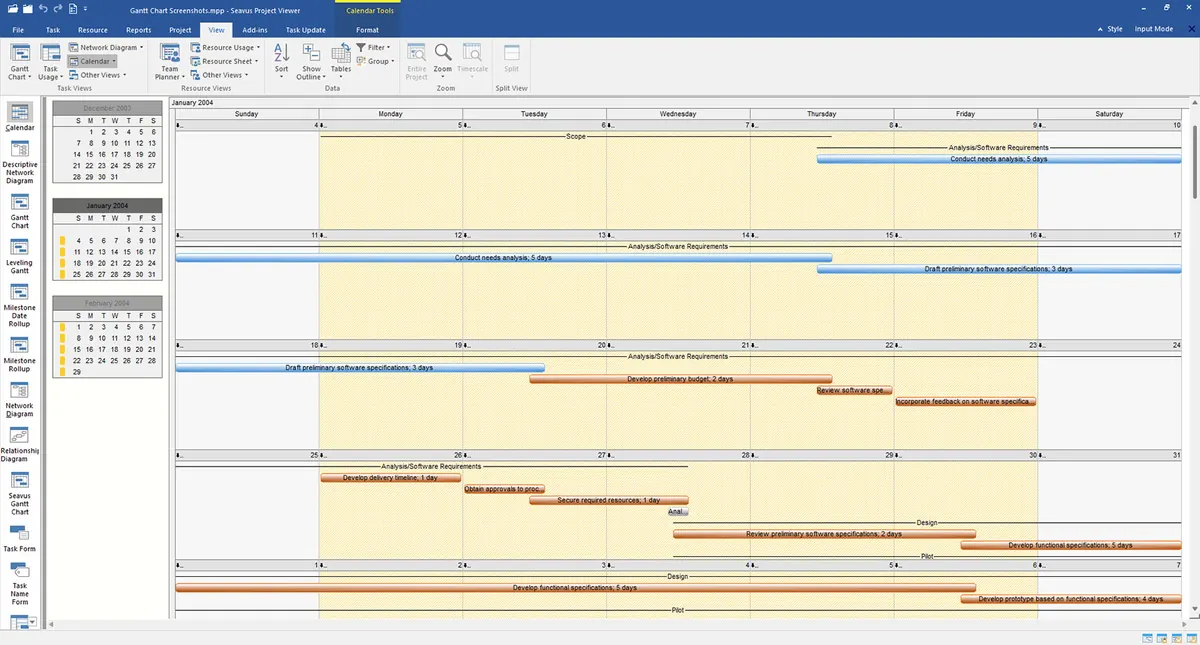
A Calendar View in Seavus Project Viewer

Calendar view

  • Classic display, tasks as bars organized by days and weeks
  • Tasks scheduled for a specific day, week or month are easy to identify

The standard Calendar view, available by default in Microsoft Project.

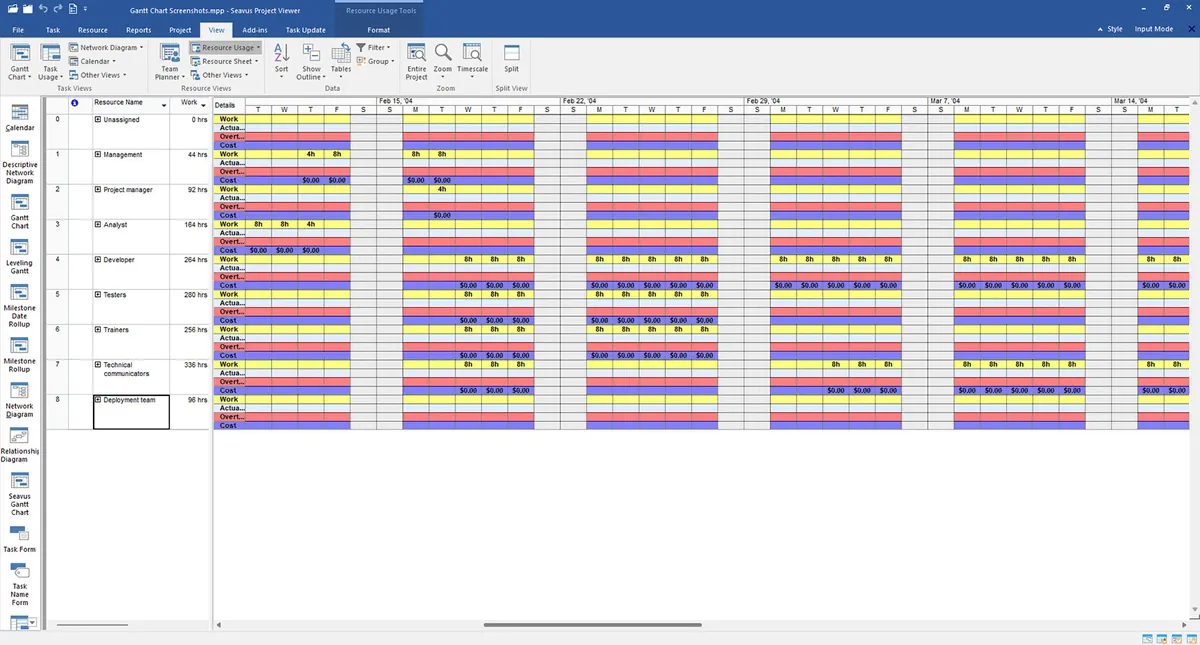
A Usage View in Seavus Project Viewer

Usage view

  • Task and resource view, with time-phased assignments in rows and columns
  • Split presentation: task and resource information on the left, detailed work and cost on the right
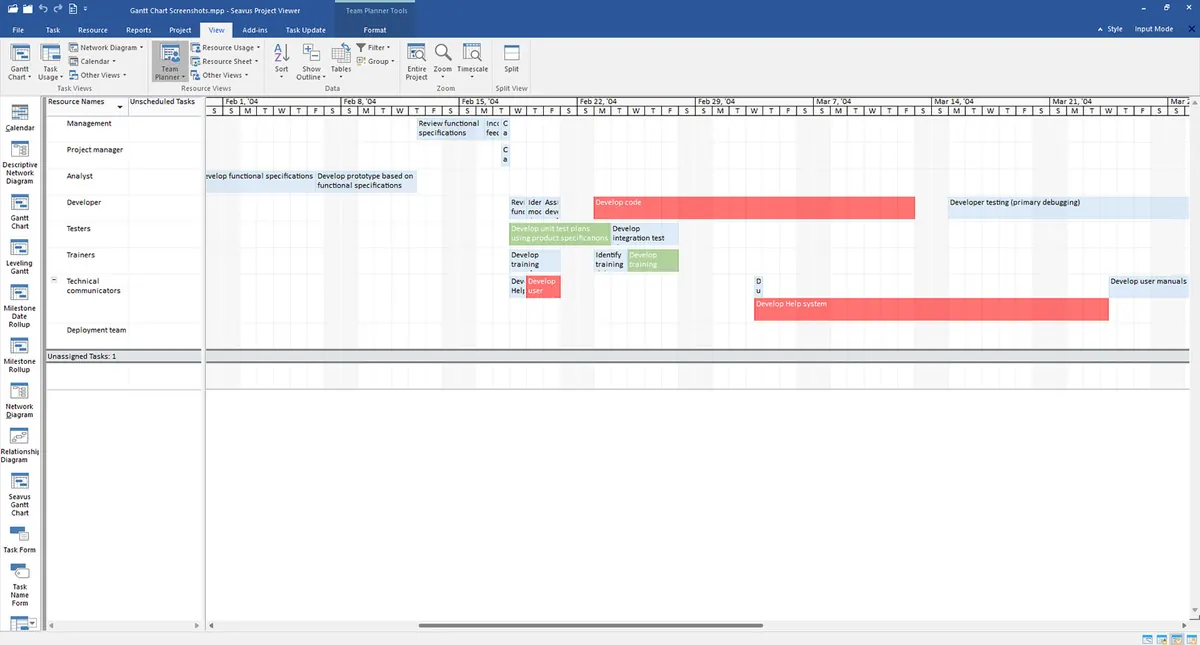
A Team Planner View in Seavus Project Viewer

Team planner

  • Combines resource assignments with tasks that have no resources yet
  • Upper frame: all assigned tasks. Lower frame: the tasks still missing resources
  • Each frame is a sheet with its resource information
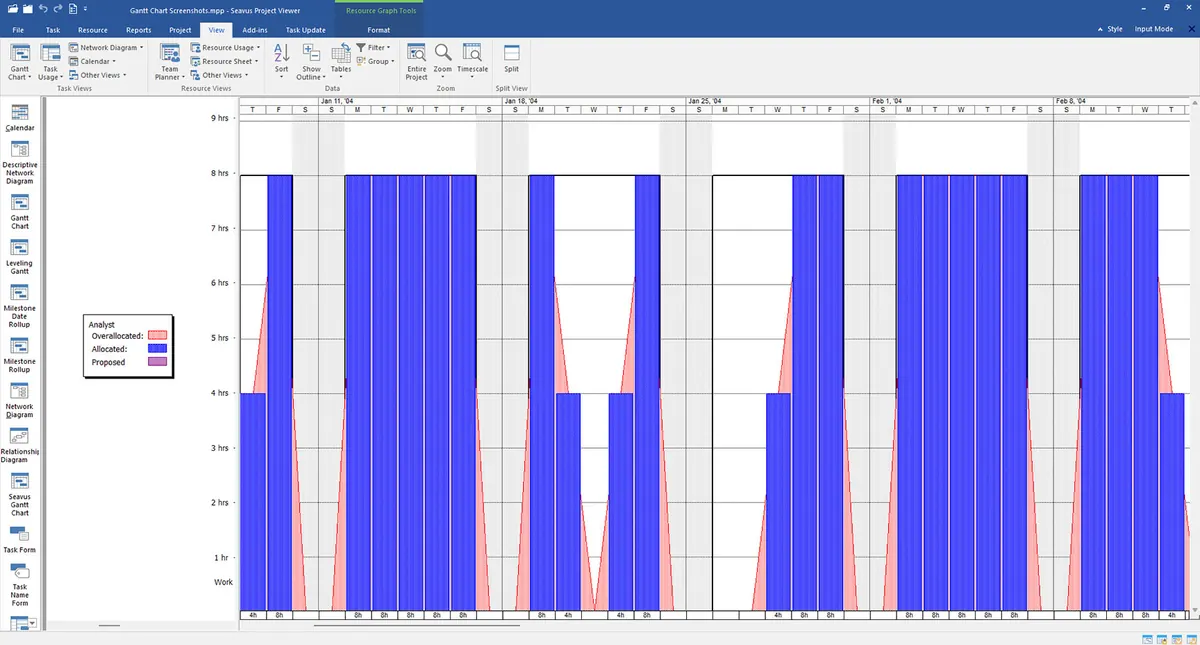
A Resource Graph View in Seavus Project Viewer

Resource graph

  • Resource allocation, work or cost over time
  • Combination view for one resource or a selection of them
  • Selecting a task shows its assigned resources alongside

In Microsoft Project

The project manager customizes and saves views with preferred default settings, formats them to the presentation standards of the organization and stores everything in the .mpp file along with the project data.

In Seavus Project Viewer

Team members open that file and see the exact replication of the formatting the project manager applied, visual styles and customizations included.

Also available

Relationship diagram, showing predecessors and successors inside the plan or beside a task. Form view, a non-graphical, in-depth record of one task that combines with a Gantt chart.

Reports and dashboards

The overall status of a project, in a form the team can act on. Reports show upcoming tasks, the ones falling behind and the critical ones, so team members and team leads can judge the health of the plan and make decisions from the data rather than from memory.

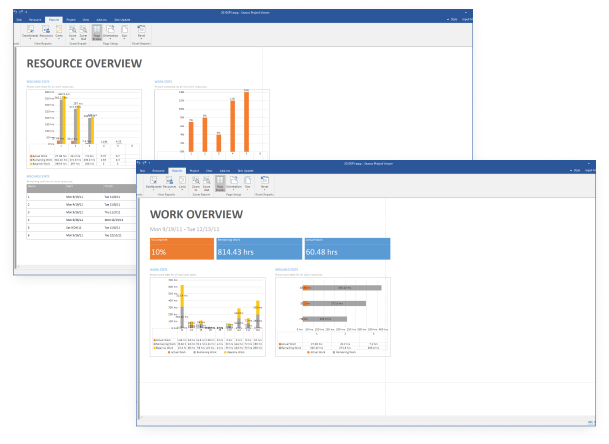
Resource and work overview reports in Seavus Project Viewer

Status reports

A vital communication medium between the project team and stakeholders

  • Updates on ongoing progress
  • Completed tasks and accomplishments
  • Budget, timeline and identified risks
  • A historical record of the project

Progress reports

An essential tool for updating stakeholders on the project’s status

  • Whether the baseline has been met
  • Expectations, schedules, costs, deliverables and scope
  • Advancements, transparency and alignment with the objectives

Dashboards

A robust way to find quick answers to specific questions

  • Tailored information in an understandable visual format
  • High-level information, organized in panels for KPI monitoring
  • Charts, features and parameters in one interface

Cost reports

Insight into the viability of a proposed financial plan

  • Actual costs and forecasts throughout delivery
  • Work, materials, equipment and profits
  • Actual against baseline costs
  • Well-informed decisions and optimized resource allocation
  • 22 chart typesColumn, bar, pie and line among them, for organizing the numerical data in the plan.
  • Easily changeable formatReport labels, tables and table sheets can all be modified.
  • Benefits of visual reportsEasily shared information, interactively explored opportunities, visible patterns and relationships, reduced workload, better understanding of support productivity.

Company standards and global templates

In a team or on a company level, global templates introduce consistency of viewing data. When you open a project (.mpp) file, the application first loads what already exists inside it: views, calendars, tables, filters and groups.

What a global template changes

Any missing component is supplied from the global template, so every plan opens with at least the views and the features the standard provides. Views the project manager modified and saved in Microsoft Project are preserved as they are.

The Options dialog points the application at another template (.mpt), stored on a local disk or reached through a network share, beyond the template installed with the product.

Create a global project template in Microsoft Project

Six steps from Microsoft Project to every viewer in the team.

  1. Create a global project template
  2. Choose the views, tables, filters, groups and calendar
  3. Save the information in a Microsoft Project template (.mpt)
  4. Share it with all project participants
  5. Import the template in Seavus Project Viewer
  6. Open the project plan in Seavus Project Viewer

Implementing company standards

One global template on a network share removes manual copying of views, tables, filters, groups and calendars, keeps every plan consistent and gives one experience without duplicating effort per project.

Simplicity and ease of use

One streamlined template per user group gives a curated set of views and features, so people stop navigating elements whose purpose they do not know and work in a familiar setting.

Personalization

Templates built in Microsoft Project travel with the product: a financial officer can ask for cost and budget views, and the team can use that setup as it is.

Customizable distribution

The MSI setup lets IT deploy a designated global template or point the installation at a network share, so users never customize the product individually.

Request an enterprise quote