A picture is worth a thousand words, is what MS Project reporting can quote relate to.
Nowadays companies are becoming increasingly project-oriented, and when governing projects, managing the expectations of other stakeholders is one of the key responsibilities of the project managers.
Project reporting can be defined as the act of summarizing project data in the form of a document, intended to communicate the status of the project or specific information related to the project to the different parties involved.
A project can have multiple stakeholders, depending on the nature of the project and the internal corporate structure.
Different roles exist, starting from the project managers and planners, who have a central role and facilitate all interaction with other parties involved in the project, to project sponsors, project directors, other higher management structures, different project employees, and even external collaborators.
These roles can all benefit from project reporting, as reports allow them to stay informed of the project status, help them make informed decisions, and better cope with their primary responsibilities.
Since early days, reports were commonly communicated in a static PDF, paper-based format, which had many limitations towards interacting with data and acquiring the needed information.
Today, software solutions like Seavus Project Viewer are increasingly used to improve project communication. These project plan viewers enable all project participants to view and interact with the project data, create and share reports and quickly get the needed information.
Microsoft Project is one of the most powerful, all-around tools for planning, managing, and reporting used in a variety of projects and one of the few tools that can complement and be parallelly used with this software to substantially improve the management of these processes is precisely the Seavus Project Viewer.
Seavus Project Viewer is a .mpp file viewing tool designed for the corporate environment and used to provide all non-MS Project users with view access to information about the project plan. This low-cost viewing tool also provides the user with the ability to generate MS Project-like reports with 100% accuracy as displayed in the original Microsoft Project software.
The MS Project Reporting Process
Reports have been one of the essential features integrated in Microsoft Project since its earliest versions and have considerably evolved to date.
The first reports in MS Project were simple, excel-like textual imprints of the project plan divided into several categories: Overview, Costs, Assignments, Workload, Current Activities, and custom reports.
The built-in visual reports came second and were greeted with much enthusiasm when first introduced, as they allowed the export of project data for further analysis in Microsoft Excel, by using pivot charts and tables.
Today, the Microsoft Project software allows users to create vivid graphical reports that match every project need, which can also be re-created with Seavus Project Viewer.
The new look and feel of the MS Project reports which we can see today were first implemented in Project version 2013. With it, a large number of predefined visual reports and dashboards, that satisfy the core needs of the project managers were put available for instant use.
The Microsoft Project graphical reports allow users to visualize the content of their project plans through vivid and eye-catching Excel-like graphs, charts and diagrams. Multiple options for report customization and new reports creation also exist.
The graphical reports are also dynamic by nature, meaning that they instantly reflect any changes made to the values in the project plan. It is easy to work with them, share them with project stakeholders and even transfer them to other Microsoft Office applications such as PowerPoint or Excel by using a simple copy/paste action.
Seavus Project Viewer has consecutively followed the Microsoft Project versions, with its own version releases, maintained support for each new version, and implemented the majority of the newly presented functionalities.
Below you can find more details about the MS project reporting process and the different available in Microsoft Project, which you can also re-create in the Seavus Project Viewer application.
Project Overview Report
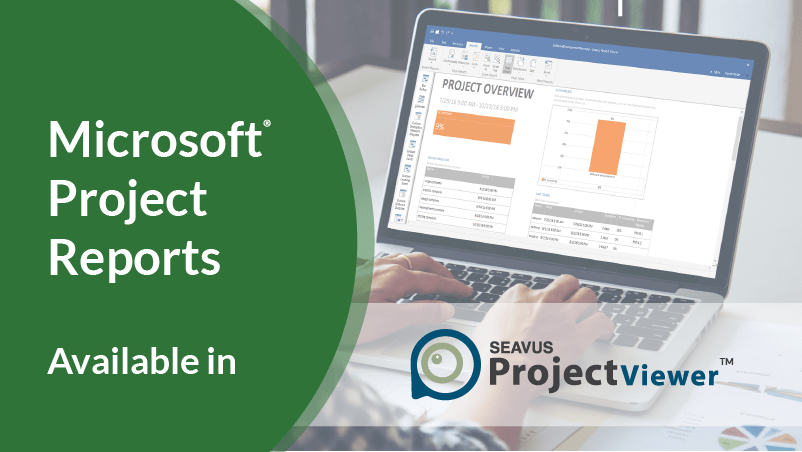
The Project Overview report belongs to the “Executive Reports” category and it gives overall information focused on the project health and progress, through the following parameters:
-
- Percent of completeness,
- Upcoming milestones
- Late tasks (task not finished on time).
The Project Overview report is very useful for the team leads and project managers to be informed about the project status or to prepare quick reports for the top management or project sponsors.
The report grabs all project task data and summarizes them with utmost simplicity in a well-organized dashboard:
The Project Overview report is generated from the Dashboard tab under the Reports View, upon a simple click of a button and can be further customized to suit the project particular requirements.
Cost Overview report
The Cost Overview report is a standard report in MS Project that belongs to the “Status Reports” category and provides in-depth information about the cost status of the project. This report indicates how financial resources are distributed over the execution period and allows the project manager to make informed decisions and take actions to keep the project within budget.
Depending on the point of view, these reports can be analyzed with focus and perspective on resource costs or task costs.
The report is accessible through the Reports View -> Dashboard Tab.
The Cost Overview report breaks down all project costs to date:
-
- Planned costs
- Actual costs
- Remaining costs
- Cumulative
- % Complete
The report can also display the baseline costs and the cost variance, which helps identify any potential cost overruns. With a little customization, these reports can be transformed into reports that belong to the “Baselines” and “Variance” categories, which gives comparisons between the planned values and the actual values.
Other Cost Reports
Microsoft Project supports the creation of similar cost reports, which are also available in Seavus Project Viewer. Below are a few of those reports:
-
- Task Cost Overview – shows data about costs associated with tasks in the project
- Resource Cost Overview – shows data about costs associated with resources
The parameters for these Cost Reports are summarized in three key visuals, each represented with unique data referring to the specific project category:
-
- Costs Status Chart
- Costs Distribution Pie Chart
- Costs Details Table
The Cost Overruns Report
The Cost Overruns report helps identify cost overruns by outlining the Task and Resource Cost variance, in addition to an Actual Cost and Baseline Costs comparison.
By identifying cost overruns on time and taking preventive or corrective actions, project managers can ensure the project stays within the limits of the planned budget.
Work Overview Report
The Work Overview report is another report that belongs to the “Status Reports” category, with the main emphasis on the project work (actual work, remaining work, work stats).
The report indicates what has been done to date and what’s left to be done.
The Work Overview report also visually breaks down all work and resource stats for top-level tasks and work resources.
The report is suited for weekly use and the purpose of the report is to provide project managers, program managers, program directors, and others with a detailed overview of the work done, per hour by the assigned resources associated with a particular task.
The stats for the work resources can also be displayed through the Resource Overview report, which is available as a separate report in Seavus Project Viewer.
Upcoming Tasks Report
The Upcoming Tasks report is another report from the Dashboard Reports tab available in both Microsoft Project and Seavus Project Viewer.
This report gives us data about the tasks that lie ahead of us, which helps us get things done and maintain a clear focus on what to do next.
The Upcoming Task report also summarizes what tasks have been done in the current week and shows the status of unfinished tasks.
This report is perfectly suited to use on a weekly basis and include in your regular status reports as it will most certainly help you keep the project on track and keep stakeholders inform of current activity and project status.
Microsoft Project Reports Summary:
Graphical reports allow us to see a visual summary of the project and all of its elements. The reporting process allows us to:
-
- Track project progress, identify risks early on, and take corrective actions that will keep the project on time and on budget
-
- Compare and analyze different sets of data, control expenses, maintain quality of work, team morale and drive the project progress
-
- Communicate project status with executives, team members, and other project stakeholders more effectively
As the leading project viewer on the market, Seavus Project Viewer is able to reproduce the Microsoft Project graphical reports with 100% accuracy, allowing even the nonplanning personal, (the users who do not use the MS Project software) to stay informed of the project progress and be involved in the MS project reporting process at all times.
Among other project viewing solutions on the market, Seavus Project Viewers prides itself on its superior software quality, and its unique features built for enterprise collaboration, the Task Update, and the Skype for Business functionality that improves project workflows.
Seavus Project Viewer has found its way to the “white list” of more than a half Fortune 500 companies and has helped them to:
-
- Reduce MS Project license costs
-
- Improve project team performance, collaboration, and communication
-
- Track and inform project stakeholders of project status and progress and keep the project on schedule
Microsoft® and Microsoft Project® have registered trademarks of Microsoft Corporation. There is no affiliation between Microsoft® Corporation and Seavus Project Viewer.
Seavus Project is available for download as a 15-day trial on the following link:


